GBP/USD AND FTSE 100 ANALYSIS AND CHARTS UK economy expands by 0.2% in January, GBP/USD remains below 1.2800. FTSE 100 bumping into multi-month resistance.
According to the latest Office for National Statistics data, the UK economy expanded by 0.2% in January, but contracted by 0.1% in the three-month period to January 2024. UK GDP is also estimated to have fallen by 0.3% in January 2024 compared with the same month last year
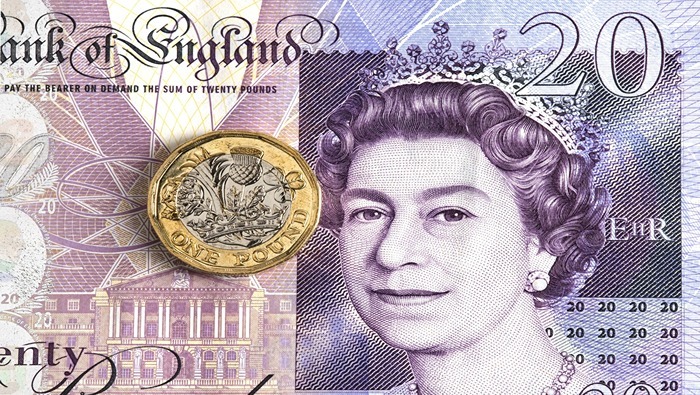
GBP/USD is treading water after two days of losses. Cable hit a multi-month high of 1.2894 last Friday before turning lower this week, but losses remain limited with first support seen around the 1.2742 area. For the pair to push ahead, last Friday’s high will need to be reclaimed but this looks unlikely at the moment with trade expected to remain on either side of 1.2800 in the short-term.
IG Retail data shows 41.74% of traders are net-long with the ratio of traders short to long at 1.40 to 1.The number of traders net-long is 6.03% higher than yesterday and 1.30% lower than last week, while the number of traders net-short is 8.33% lower than yesterday and 1.22% lower than last week.
We typically take a contrarian view to crowd sentiment, and the fact traders are net-short suggests GBP/USD prices may continue to rise.t
See How IG Client Sentiment Can Help Your Trading Decisions
The recent FTSE 100 rally has stalled in early trade today, unable to break through an area of multi-month prior resistance. The CCI indicator shows the market as heavily overbought and this reading will need to be dialled back if the UK big board is to move higher. A confirmed break above resistance around the 7,767 area would bring 7,937 back into play.

